Better Kubernetes troubleshooting for more reliable apps
A unique approach to Kubernetes monitoring that shifts troubleshooting from issue resolution to application improvement.
No more switching between 5-7 different tools
Get expert guidance out of the box
Understand business impact and resource dependencies in real-time
Optimize and operate Kubernetes applications for peak performance
Built-in kubernetes best practices and expert guidance play a pivotal role in every stage.
Pinpoint opportunities to take app reliability to the next level
Identify key areas in your Kubernetes environment lacking SLIs
Detect performance degradation and spot weak areas before alerts trigger
Eliminate context switching and the need for multiple tools
Translate complex issues into dev-related terms, making Kubernetes accessible to all
Streamline Kubernetes monitoring without bouncing between tools
Comprehensive observability data, all in one place.
Whether you’re maintaining your applications or troubleshooting an issue, we’ve eliminated the need to navigate between multiple tools by consolidating all observability data into one centralized location. StackState offers complete 360° observability tailored to the context of your entire Kubernetes landscape by gathering and correlating crucial metrics, changes, events, and traces. You can choose to manually slice the data into the right sub views, or let the platform handle it automatically through related clusters, pods, namespaces, and labels — whichever you prefer.
Best practices, built by experts, fine-tuned by you
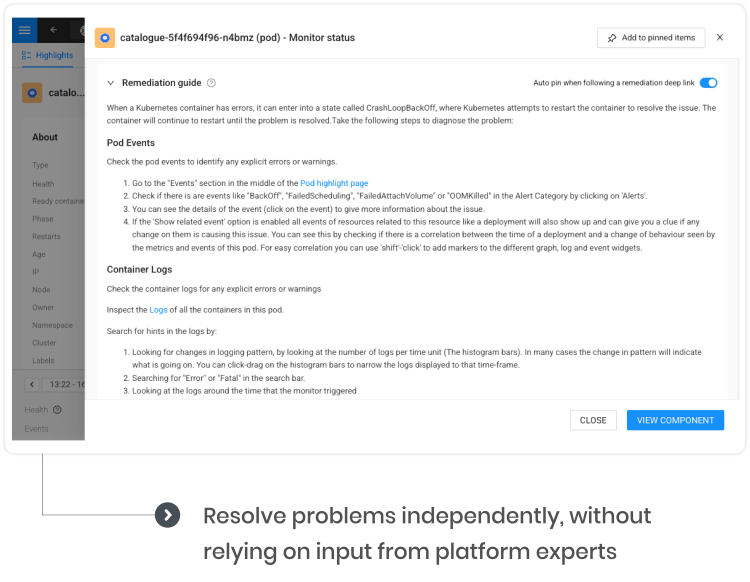
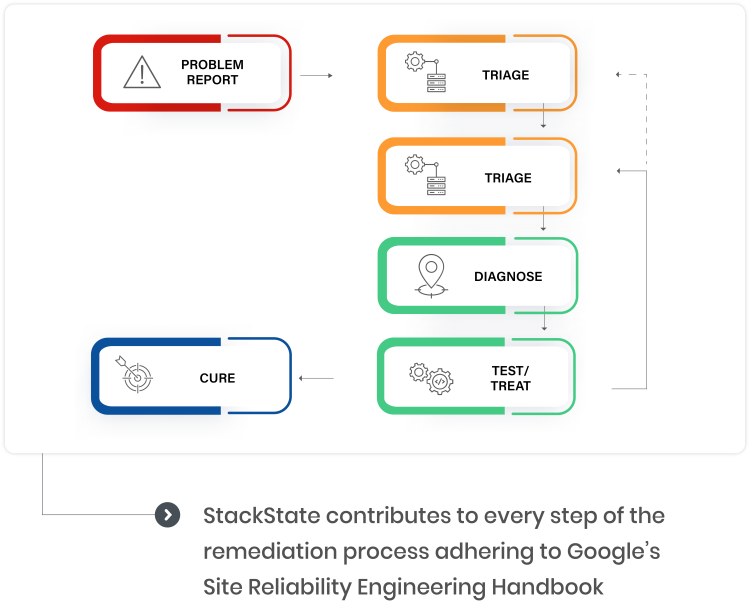
Step-by-step playbooks lead to the cause of common issues so you can troubleshoot them before they impact customers.
After identifying an issue, StackState triggers pre-configured best practices, followed by proven, easy-to-follow remediation guides. With smart problem clustering, troubleshooting hints, and real-time visual assistance, you'll seamlessly move from easy identification to prompt resolution of issues. Then, extend our built-in best practices by empowering your internal experts to define new policies or adjust prescribed steps to better suit your Kubernetes environment, team composition, and unique requirements.

Proactive monitoring can catch changes before they cause trouble
Keep operations running smoothly by tracking both real-time and historical changes.
Nine out of ten Kubernetes incidents trace back to changes in a resource or relationship. Through StackState’s Change Tracking and Topology Intelligence, you can now easily pinpoint these changes and understand their impact on your Kubernetes-based apps. This automated process monitors, correlates, and analyzes both topology shifts and metrics, offering a real-time grasp of your entire cluster. Utilize it to link failures with configuration changes, explore change history on a chronological timeline, and identify manual edits that bypass your CI/CD process.
Discover the impact of interconnected resources at any moment in time
Industry-leading, interactive dependency maps provide an unmatched level of detail.
Move beyond basic service, network, or infrastructure mapping. StackState automatically discovers and visualizes all Kubernetes dependencies, which reveals the real-time tracking of resource changes, the exploration of past changes, and the prevention of recurrences. We leave no stone unturned: our dependency maps include every resource from clusters, namespaces, services, pods, containers, and processes.
Easy installation + immediate value = 100% visibility
Unparalleled observability in real-time and over time.
Leverage the extraordinary capabilities of our eBPF instrumentation to cover your entire Kubernetes stack — no code changes are required! It’s fast and easy – with two commands, the extremely low-overhead, eBPF-based agent is installed on all Kubernetes nodes.
The out-of-the-box integration automatically relates all topology, telemetry, and events within the environment. It effortlessly monitors golden signals — latency, error rate, and throughput — for all your pods, processes, and services. What does this mean for you? It translates to rapid identification and resolution of almost all issues within minutes.
Lean on SRE best practices for maximum troubleshooting effectiveness
Like having the top-rated Site Reliability Engineer on staff to provide real-time guidance.
Beyond troubleshooting, StackState is a versatile tool for SREs, allowing them to precisely locate weak areas, identify performance fluctuations, and highlight areas lacking SLIs. The platform also identifies teams and functions that can benefit from improved observability and offers insights into the reasons behind such recommendations. In advance of component failures and alerts, StackState proactively highlights rising thresholds across the application, so issues can be addressed before they escalate.

Find issues and fix them fast with better observability
By streamlining Kubernetes monitoring and troubleshooting, StackState enables teams to navigate app complexities and optimize performance with minimal business interruption. The StackState full stack observability platform and expert knowledge base can help you resolve Kubernetes issues on the first try, scale services, and improve app performance and reliability.
Want to learn how StackState can empower your teams?
