
LM Envision
Hybrid observability powered by AI
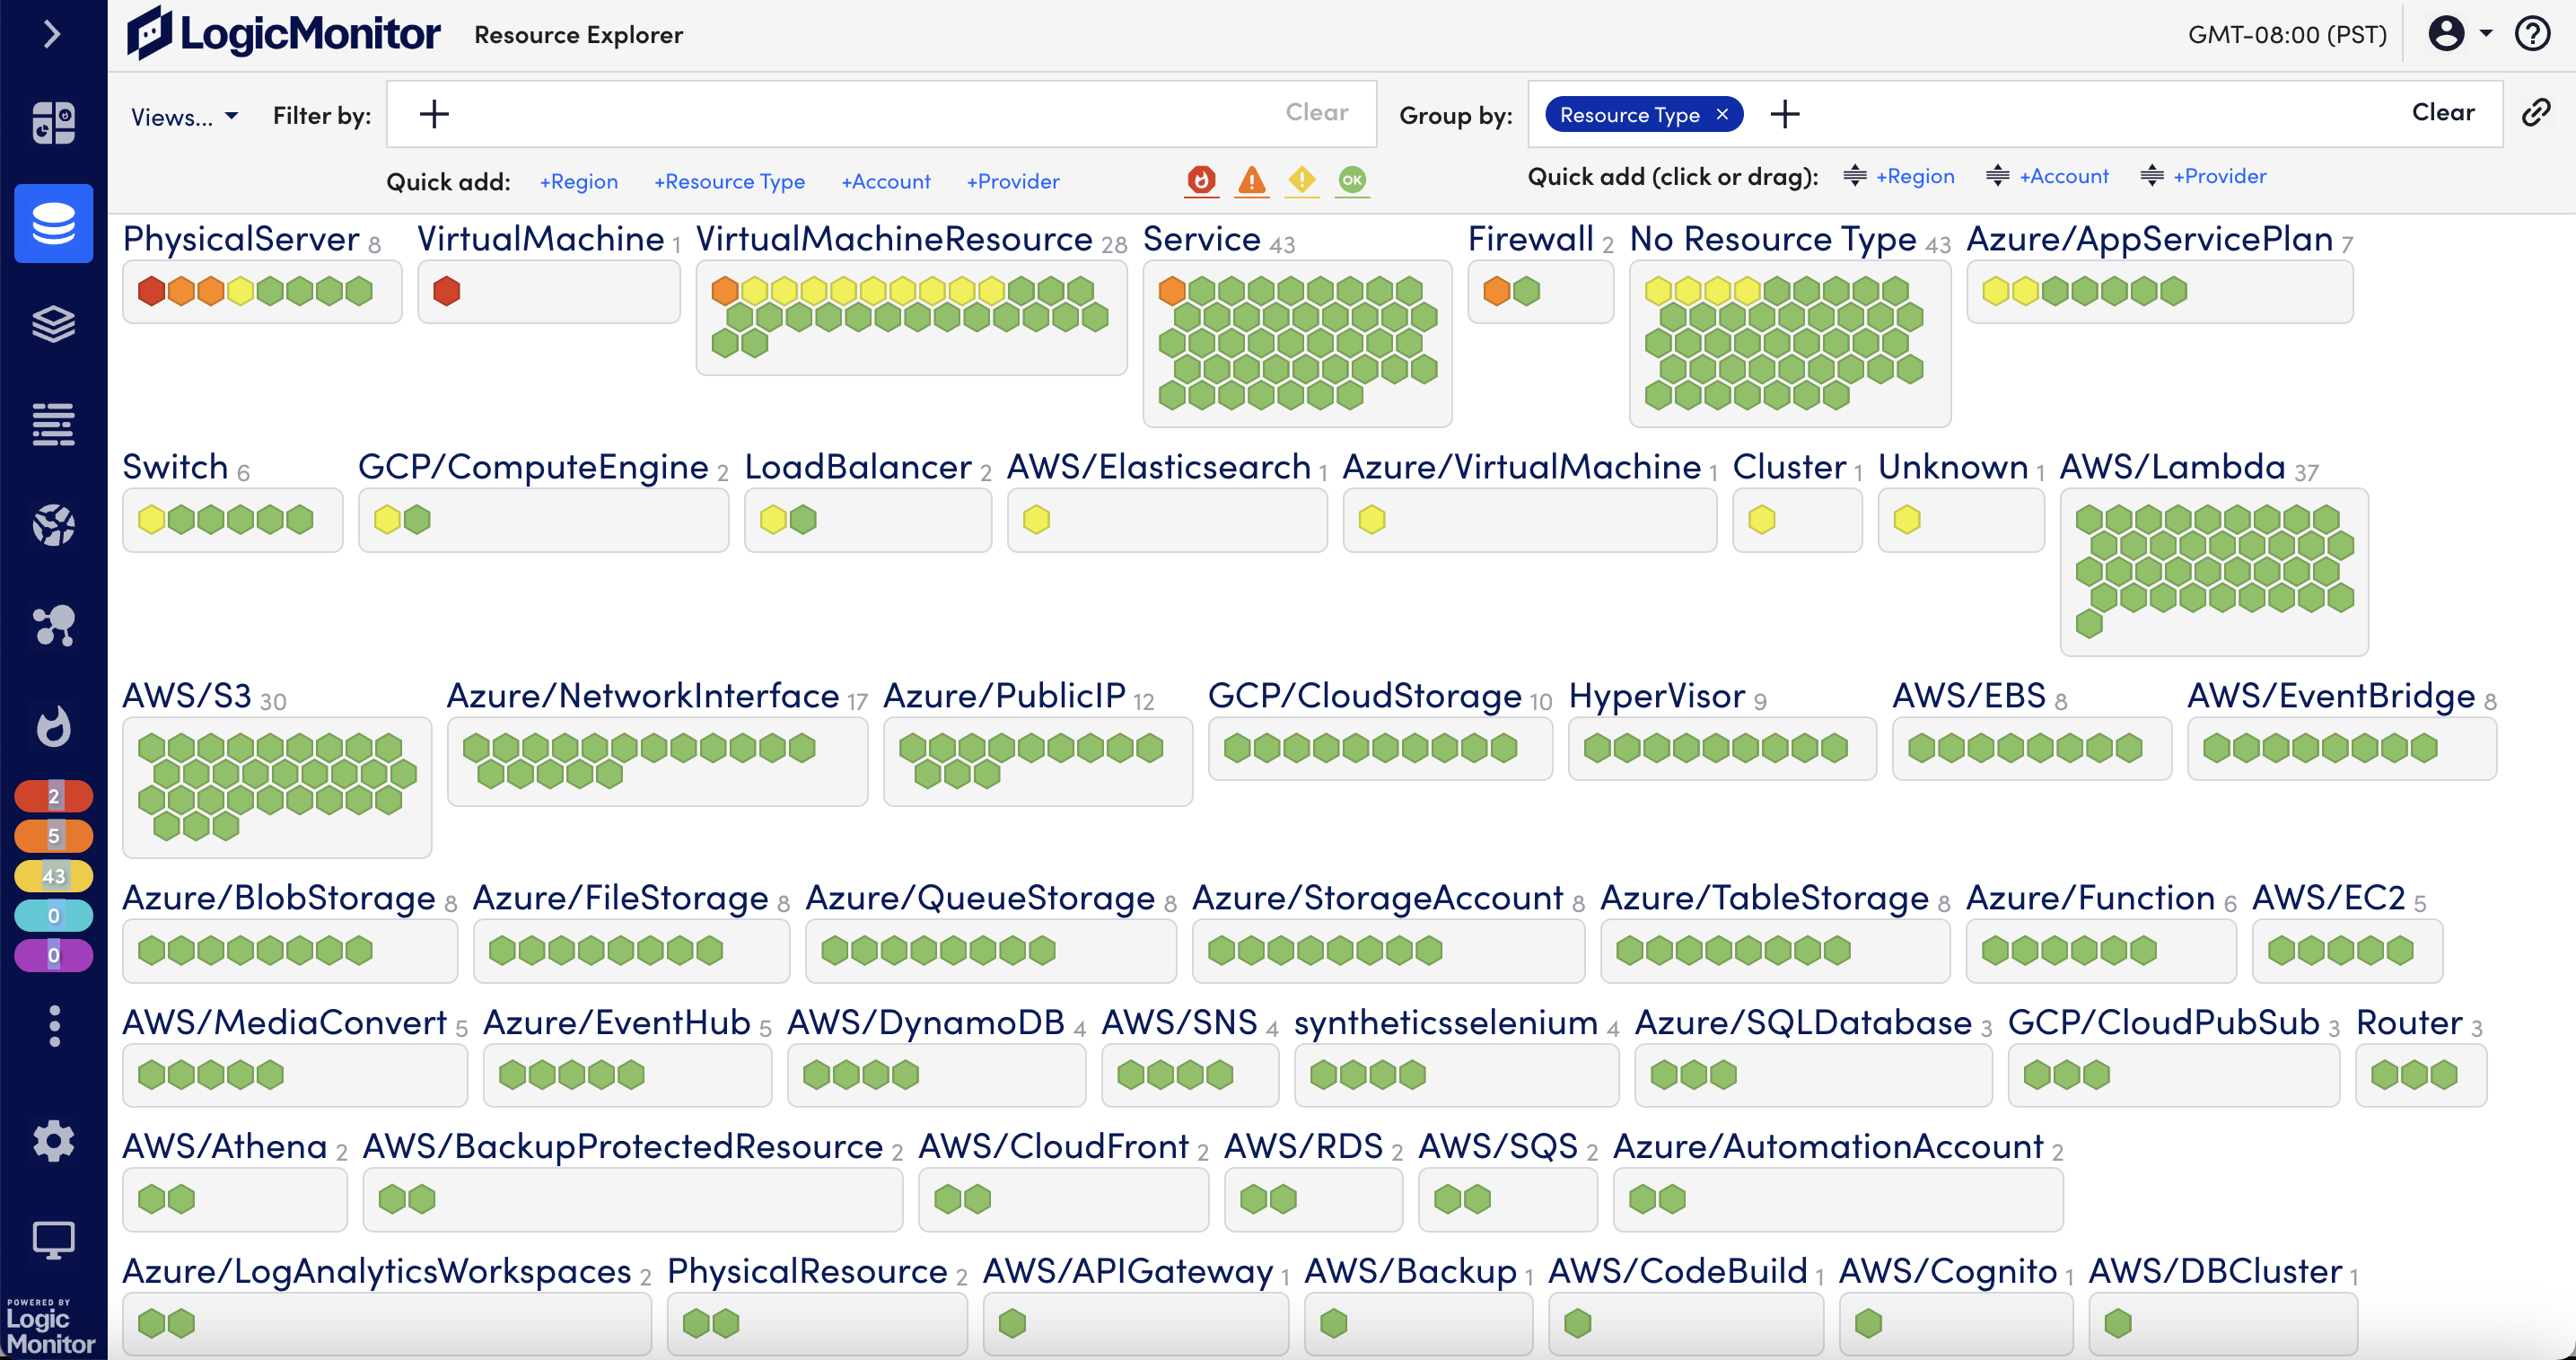
Clarity for enterprise IT. LM Envision unites comprehensive monitoring and observability capabilities across your entire infrastructure: data centers, hybrid environments and public clouds with application insights across traditional, SaaS, and cloud-native. Get correlation, context, and clarity to understand the true causes and business impact of complex IT incidents.
LM Envision platform
LM Envision platform
Service context
AIOps
Unified
experience
Data lake
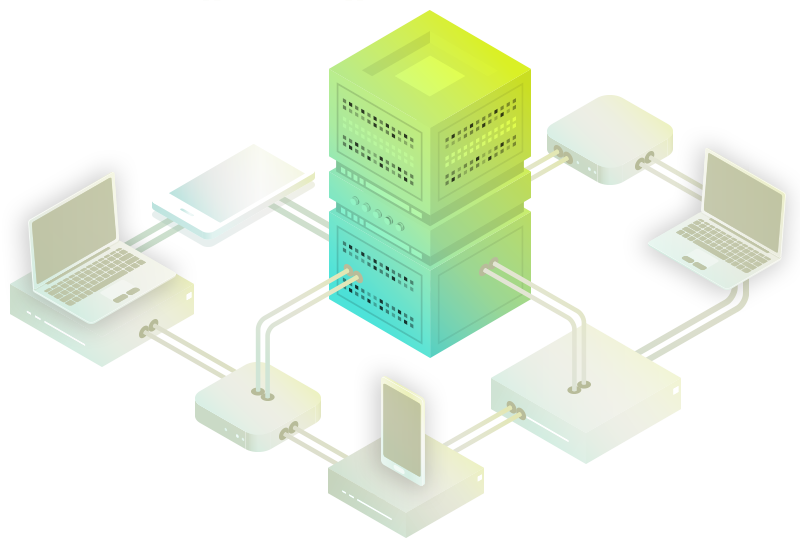
The AI for Hybrid Observability Platform
Infrastructure Monitoring
Predictive insights in your cloud, on-premises and hybrid environments, and intelligent troubleshooting to scale
Log Analysis
Log intelligence at scale for hybrid and multi-cloud environments
Network
Monitor the health and performance of your entire network infrastructure in one secure platform.
Cloud
Maximize your investment in AWS, Azure, GCP, and other cloud services
Servers
Agentless visibility across on-prem and virtual servers, instantly and automatically
Websites
On-the-spot service checks to optimize health and performance
Containers
Monitor Kubernetes pods, nodes, containers, services, and so much more
Remote Monitoring
Ensure your remote workforce has access to the tools they need to maintain business continuity
Application Performance Monitoring
Contextually bring together traces, metrics, and synthetics
Storage
Insights into on-premises, hyper-converged, and cloud-based storage systems in one unified view
Database Monitoring
Correlate database health and performance side by side with your dynamic infastructure
Virtual Machine Monitoring
Get in-depth monitoring of your entire virtualization stack in a snap
The full package, plus powerful features
AIOps Early Warning System
Pinpoint problems and reduce MTTR with root cause analysis and dynamic thresholds for real-time anomaly detection
- Identify performance trends across the entire IT infrastructure and application landscape
- Troubleshoot issues before they occur with AIOps Early Warning alerts
- Correlate IT and business metrics to visualize the true impact of IT performance
Configuration Monitoring
Monitor and alert on configuration changes across multiple networks, data centers or customer locations.
- Correlate performance to configuration changes in your IT environment
- Improve efficiency and reduce MTTR
- Customize configuration alerts
Context
Dive into the monitoring metrics that matter most to your team from services, applications and infrastructure
- Monitoring across networks, systems, storage and other IT Infrastructure
- Application microservices based on OpenTelemetry with business context and vendor independence
- Logging to support infrastructure monitoring, anomaly detection, and troubleshooting
- AWS, GCP, Microsoft Azure, and SaaS services for M365, Okta and Zoom
- Kubernetes, Docker, EKS and ECS containers and pods
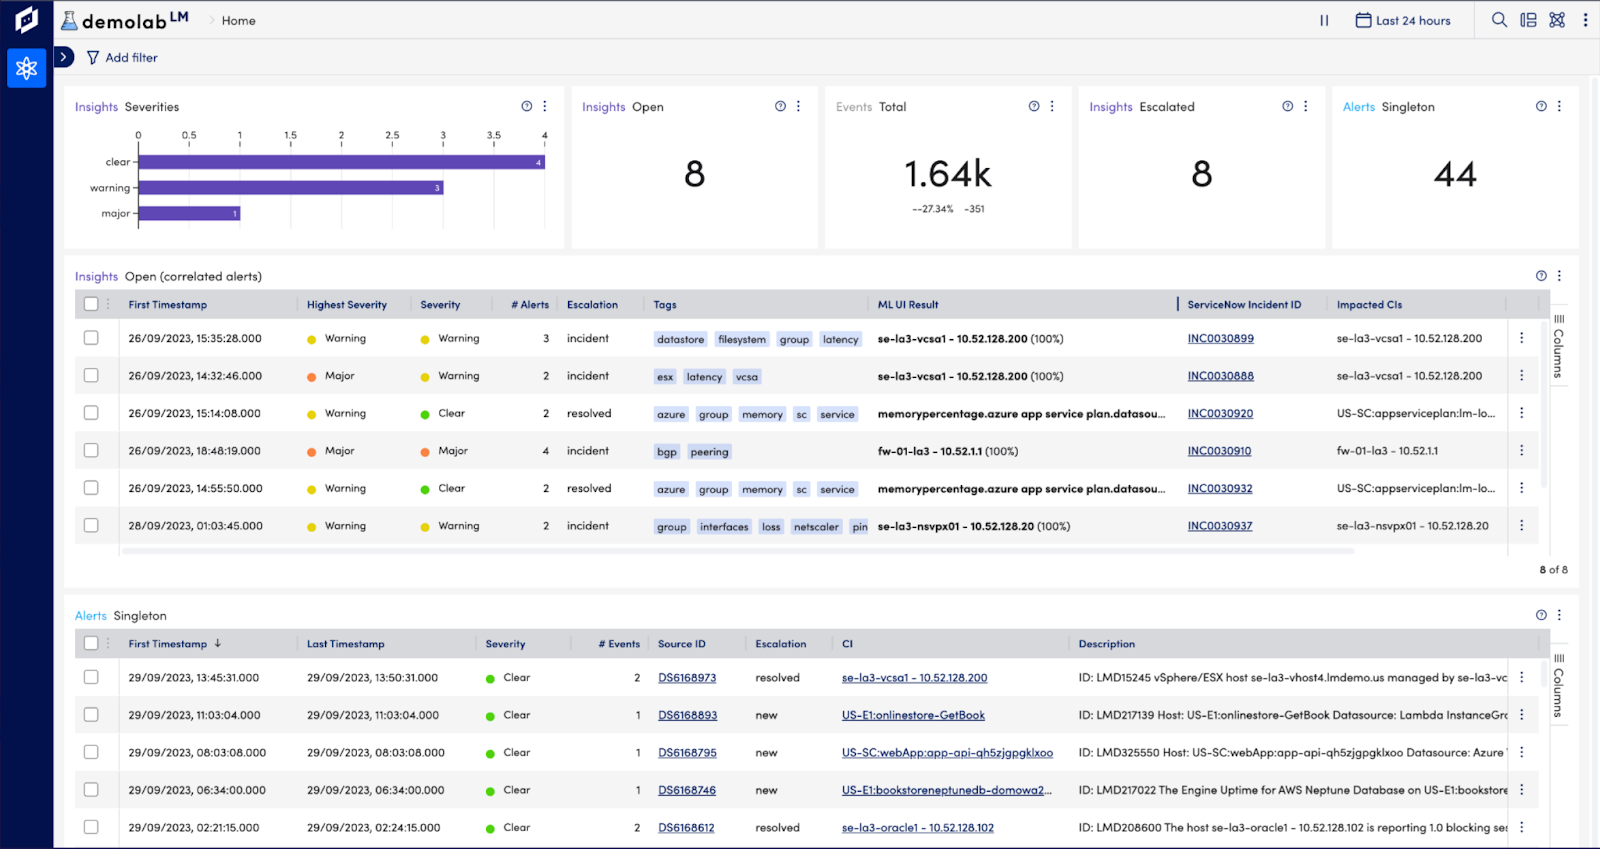
Correlation
LM Envision correlates data across your entire tech stack to reach unparalleled observability
- Retain and empower Ops teams with automated insights across modern IT environments
- Reduce time to resolve problems by correlating problems with root cause
- Prevent downtime and performance degradation by identifying trends and their underlying causes
Intelligence
LM Envision provides common data onboarding management, and exploration across infrastructure, applications and IT stacks, creating a single source of truth.
- Accelerate onboarding with a robust ecosystem of community-supported LM Modules
- Monitor and troubleshoot using an intuitive interface with dashboarding, reporting, and data exploration
- Leverage AIOps capabilities for anomaly detection, early warning alerting, and accelerated focus on root cause
- Connect to additional data sources to provide insights, including business impact of IT performance
Clarity across hybrid enterprise IT
Observability for ITOps & DevOps
Increased innovation and efficiency
Unified Observability
More than a platform.
A path to success.
See how LM Envision paves the way to unified observability
Connect
Connect lightweight technology & automated deployment.
- Install our agentless collectors onto your servers
- Devices are recognized and instantly auto-configured based on best practices
- LogicMonitor starts collecting performance metrics Immediately

Customize
Customize your monitoring & streamline your operations.
- Dynamic alert thresholds remove noise; workflows and escalation chains are tailored to your environment
- Directly respond to and manage alerts via email, SMS, Slack, or voice
- Graph everything from high-level KPIs to granular technical metrics

Align
Combine all your LogicModules into a single source of truth.
- Leverage prebuilt integrations for 2,000+ technologies
- Easily add custom data sources for any device or API that puts out data
- Eliminate visibility gaps with topology mapping, anomaly detection, and more
Unify
Unify teams with facts that amplify value.
- Customize user privileges with role-based access controls
- Increase data visibility with shareable dashboards and reports
- Export business-relevant metrics to your preferred Business Intelligence tools

Accelerate
Look to the future by identifying potential problems and opportunities.
- Dynamic alert thresholds remove noise; workflows and escalation chains are tailored to your environment
- Stay up and running during downtime and outages
- Empower proactive IT Infrastructure Monitoring with historical, current, and forecasted data
Recognized for Excellence


Rated “Excellent” and an “Editor’s Choice” by PCMag
Excellent
The highest NetPromoter score of any IT Infrastructure Management provider at 95% satisfaction.
95%
4.5/5 rating from Gartner Peer Insights and Customer Satisfaction leader on G2
4.5/5
More than 2,000 out-of-the-box integrations, including:


Sign up with your 14 day trial
Try LogicMonitor for free, or get in touch with an expert for a custom demo of the platform